Whatever message this page gives is out now! Go check it out!


Create boxplots in ColdFusion
Last update:
May 18, 2026
A boxplot, or a box-and-whisker plot, visualizes a dataset's distribution that summarizes key statistical metrics. Boxplots help in exploratory data analysis by visualizing the distribution of data points and identifying potential outliers.
Parts of a boxplot:
- Box: It is the Interquartile Range (IQR), which is the middle 50% of the data, between Q1 (first quartile) and Q3 (third quartile).
- Q1 (25th percentile): The lower edge of the box.
- Q3 (75th percentile): The upper edge of the box.
- Median: A line indicating the 50th percentile of the dataset.
- Whiskers: Lines extending from the box to the smallest and largest values within 1.5 times the IQR from Q1 and Q3. The values outside of this range are outliers.
Developers use boxplots to visualize the distribution of data, detect outliers, compare distributions, and summarize data. In real-world scenarios, boxplots help in performance benchmarking or visualizing execution times across environments. In doing so, outliers may emerge, indicating extreme values.
Boxplots in ColdFusion
ColdFusion lets you create and use boxplots in multiple ways. To do so, use the chart type as boxplot in the cfchart tag. Along with cfchart, specify the data using the cfchartseries tag. Additionally, if you want to arrange multiple boxplots in a grid-like manner, use the cfchartseries tag.
cfchart
Add boxplot as type in the cfchart tag. For example,
<cfchart type="boxplot" format="html" title="First boxplot" width="600" height="400"/>
ColdFusion also adds styling options to boxplots. The options struct lets you define styling options for boxplot boxes, outliers, min, median, or max lines.
Options
Attribute | Description |
box | Defines the styling of the boxes in the boxplot. You can set the width and background color of the boxplot. |
line-min-level | Defines the styling of the line at the minimum value in the boxplot. |
line-median-level | Defines the styling of the line at the median value in the boxplot. |
line-max-level | Defines the styling of the line at the maximum value in the boxplot. |
line-min-connector | Defines the styling of the whisker that connects the box plot and the minimum value line. |
line-max-connector | Defines the styling of the whisker that connects the box plot and the maximum value line. |
outlier | Defines the styling of the outliers using markers. |
Define the data for the boxplot
The data for the boxplots are available as key-value pairs.
Create an object, for example, boxStruct, that contains the following:
key | The name of the boxplot series on the X or Y axis. For example, |
boxplotStruct={

        "key"="Experiment one results",

        "data"= [24, 30, 35, 38, 45, 45, 46, 48, 49, 51, 52, 53, 56, 57, 59, 60, 62, 70]

}
data | The data array contains the data points to be plotted in the boxplot. For example, |
boxplotStruct={

        "key"="Experiment one results",

        "data"= [24, 30, 35, 38, 45, 45, 46, 48, 49, 51, 52, 53, 56, 57, 59, 60, 62, 70]

}
dataBox | The dataBox array contains five values, minimum, first quartile, median, third quartile, and maximum values of the dataset. The length of the dataBox array must be five. For example, |
boxplotStruct={

        "key"="Experiment three results",

        "dataBox"=[35, 50, 45, 40, 55], // [min, q1, median, q3, max]

}
dataOutlier | The dataOutlier array contains the outliers of the boxplot. The array can contain multiple outliers. For example, |
boxplotStruct={

        "key"="Experiment three results",

        "dataBox"=[35, 50, 45, 40, 55], // [min, q1, median, q3, max]

        "dataOutlier"=[25,60] // outlier array

}
Examples
Let’s understand boxplots with the help of a few examples. We’ll start with creating a basic boxplot and gradually work our way through creating a comprehensive boxplot.
Example 1- A bare minimum, out of the box boxplot.

<cfscript>

    data = [24, 30, 35, 38, 45, 45, 46, 48, 49, 51, 52, 53, 56, 57, 59, 60, 62, 70]

</cfscript>

<cfchart type="boxplot"  format="html" title="First boxplot" width="600"  height="400">

    <cfchartseries data="#data#">

</cfchart>
Output

Example 2 - Output of example 1+series label
<cfscript>

    ex={

        "key"="Experiment results",

        "data"= [24, 30, 35, 38, 45, 45, 46, 48, 49, 51, 52, 53, 56, 57, 59, 60, 62, 70]

    }

</cfscript>

<cfchart type="boxplot"  format="html" title="Second boxplot" width="600"  height="400">

    <cfchartseries data="#ex#">

</cfchart>
Output

Example 3 - Output of Example 2+second boxplot
<cfscript>

    ex1={

        "key"="Experiment one results",

        "data"= [24, 30, 35, 38, 45, 45, 46, 48, 49, 51, 52, 53, 56, 57, 59, 60, 62, 70]

    }

    ex2={

        "key"="Experiment two results",

        "data"= [45, 25, 29, 50, 40, 56, 32, 32, 46, 65, 66, 24, 31, 29, 23, 30, 65, 56]

    }

</cfscript>

<cfchart type="boxplot"  format="html" title="Third boxplot" width="600"  height="400">

    <cfchartseries data="#ex1#">

    <cfchartseries data="#ex2#">

</cfchart>
Output

Example 4- Output of Example 3+dataBox array
<cfscript>

    ex1={

        "key"="Experiment one results",

        "data"= [24, 30, 35, 38, 45, 45, 46, 48, 49, 51, 52, 53, 56, 57, 59, 60, 62, 70]

    }

    ex2={

        "key"="Experiment two results",

        "data"= [45, 25, 29, 50, 40, 56, 32, 32, 46, 65, 66, 24, 31, 29, 23, 30, 65, 56]

    }

    ex3={

        "key"="Experiment three results",

        "dataBox"=[35, 50, 45, 40, 55]

    }

</cfscript>

<cfchart type="boxplot"  format="html" title="Fourth boxplot" width="600"  height="400">

    <cfchartseries data="#ex1#">

    <cfchartseries data="#ex2#">

    <cfchartseries data="#ex3#">

</cfchart>
Output

Example 5 - Output of Example 4+dataOutlier array
<cfscript>

    ex1={

        "key"="Experiment one results",

        "data"= [24, 30, 35, 38, 45, 45, 46, 48, 49, 51, 52, 53, 56, 57, 59, 60, 62, 70]

    }

    ex2={

        "key"="Experiment two results",

        "data"= [45, 25, 29, 50, 40, 56, 32, 32, 46, 65, 66, 24, 31, 29, 23, 30, 65, 56]

    }

    ex3={

        "key"="Experiment three results",

        "dataBox"=[35, 50, 45, 40, 55], // [min, q1, median, q3, max]

        "dataOutlier"=[25,60] // outlier array

    }

</cfscript>

<cfchart type="boxplot"  format="html" title="Fifth boxplot" width="600"  height="400">

    <cfchartseries data="#ex1#">

    <cfchartseries data="#ex2#">

    <cfchartseries data="#ex3#">

</cfchart>
Output

Example 6 - Output of Example 5+boxplot width styling
<cfscript>

    ex1={

        "key"="Experiment one results",

        "data"= [24, 30, 35, 38, 45, 45, 46, 48, 49, 51, 52, 53, 56, 57, 59, 60, 62, 70]

    }

    ex2={

        "key"="Experiment two results",

        "data"= [45, 25, 29, 50, 40, 56, 32, 32, 46, 65, 66, 24, 31, 29, 23, 30, 65, 56]

    }

    ex3={

        "key"="Experiment three results",

        "dataBox"=[35, 50, 45, 40, 55], // [min, q1, median, q3, max]

        "dataOutlier"=[25,60] // outlier array

    }

    // boxplot styling options

    options={

        "box"={

            "bar-width":0.9,

            "background-color": "green"

        }

    }

</cfscript>

<cfchart type="boxplot"  format="html" title="Seventh boxplot" width="600"  height="400" options="#options#">

    <cfchartseries data="#ex1#">

    <cfchartseries data="#ex2#">

    <cfchartseries data="#ex3#">

</cfchart>
Output

Example 7 - Output of Example 6+min, median, and max line color styling
<cfscript>

    ex1={

        "key"="Experiment one results",

        "data"= [24, 30, 35, 38, 45, 45, 46, 48, 49, 51, 52, 53, 56, 57, 59, 60, 62, 70]

    }

    ex2={

        "key"="Experiment two results",

        "data"= [45, 25, 29, 50, 40, 56, 32, 32, 46, 65, 66, 24, 31, 29, 23, 30, 65, 56]

    }

    ex3={

        "key"="Experiment three results",

        "dataBox"=[35, 50, 45, 40, 55], // [min, q1, median, q3, max]

        "dataOutlier"=[25,60] // outlier array

    }

    // boxplot styling options

    options={

        "box"={

            "bar-width":0.9,

            "background-color": "green"

        },

        "line-min-level": {

            "line-color": "red",

            "line-width":2

        },

        "line-median-level": {

            "line-color": "blue",

            "line-width":2

        },

        "line-max-level": {

            "line-color": "black",

            "line-width":2

        }

    }

</cfscript>

<cfchart type="boxplot"  format="html" title="Seventh boxplot" width="600"  height="400" options="#options#">

    <cfchartseries data="#ex1#">

    <cfchartseries data="#ex2#">

    <cfchartseries data="#ex3#">

</cfchart>
Output

Example 8 - Output of Example 7+connector styling
<cfscript>

    ex1={

        "key"="Experiment one results",

        "data"= [24, 30, 35, 38, 45, 45, 46, 48, 49, 51, 52, 53, 56, 57, 59, 60, 62, 70]

    }

    ex2={

        "key"="Experiment two results",

        "data"= [45, 25, 29, 50, 40, 56, 32, 32, 46, 65, 66, 24, 31, 29, 23, 30, 65, 56]

    }

    ex3={

        "key"="Experiment three results",

        "dataBox"=[35, 50, 45, 40, 55], // [min, q1, median, q3, max]

        "dataOutlier"=[25,60] // outlier array

    }

    // boxplot styling options

    options={

        "box"={

            "bar-width":0.9,

            "background-color": "green"

        },

        "line-min-level": {

            "line-color": "red",

            "line-width":2

        },

        "line-median-level": {

            "line-color": "blue",

            "line-width":2

        },

        "line-max-level": {

            "line-color": "black",

            "line-width":2

        },

        'line-min-connector': {

            'line-width':2,

            'line-color': "##f00"

        },

        'line-max-connector': {

            'line-color': "black",

            'line-width':4

        }

    }

</cfscript>

<cfchart type="boxplot"  format="html" title="Eighth boxplot" width="600"  height="400" options="#options#">

    <cfchartseries data="#ex1#">

    <cfchartseries data="#ex2#">

    <cfchartseries data="#ex3#">

</cfchart>
Output

Example 9 - Output of Example 8+outlier marker styling
<cfscript>

    ex1={

        "key"="Experiment one results",

        "data"= [24, 30, 35, 38, 45, 45, 46, 48, 49, 51, 52, 53, 56, 57, 59, 60, 62, 70]

    }

    ex2={

        "key"="Experiment two results",

        "data"= [45, 25, 29, 50, 40, 56, 32, 32, 46, 65, 66, 24, 31, 29, 23, 30, 65, 56]

    }

    ex3={

        "key"="Experiment three results",

        "dataBox"=[35, 50, 45, 40, 55], // [min, q1, median, q3, max]

        "dataOutlier"=[25,60] // outlier array

    }

    // boxplot styling options

    options={

        "box"={

            "bar-width":0.9,

            "background-color": "green"

        },

        "line-min-level": {

            "line-color": "red",

            "line-width":2

        },

        "line-median-level": {

            "line-color": "blue",

            "line-width":2

        },

        "line-max-level": {

            "line-color": "black",

            "line-width":2

        },

        'line-min-connector': {

            'line-width':2,

            'line-color': "##f00"

        },

        'line-max-connector': {

            'line-color': "black",

            'line-width':4

        },

        "outlier":{

            "marker":{

                "type"="circle",

                "background-color": "##ff0"

            }

        }

    }

</cfscript>

<cfchart type="boxplot"  format="html" title="Ninth boxplot" width="600"  height="400" options="#options#">

    <cfchartseries data="#ex1#">

    <cfchartseries data="#ex2#">

    <cfchartseries data="#ex3#">

</cfchart>
Output

Example 10 - Horizontal boxplot
Specify hboxplot as type in cfchart.
<cfscript>

    ex1={

        "key"="Experiment one results",

        "data"= [24, 30, 35, 38, 45, 45, 46, 48, 49, 51, 52, 53, 56, 57, 59, 60, 62, 70]

    }

    ex2={

        "key"="Experiment two results",

        "data"= [45, 25, 29, 50, 40, 56, 32, 32, 46, 65, 66, 24, 31, 29, 23, 30, 65, 56]

    }

    ex3={

        "key"="Experiment three results",

        "dataBox"=[35, 50, 45, 40, 55], // [min, q1, median, q3, max]

        "dataOutlier"=[25,60] // outlier array

    }

    // boxplot styling options

    options={

        "box"={

            "bar-width":0.9,

            "background-color": "green"

        },

        "line-min-level": {

            "line-color": "red",

            "line-width":2

        },

        "line-median-level": {

            "line-color": "blue",

            "line-width":2

        },

        "line-max-level": {

            "line-color": "black",

            "line-width":2

        },

        'line-min-connector': {

            'line-width':2,

            'line-color': "##f00"

        },

        'line-max-connector': {

            'line-color': "black",

            'line-width':4

        },

        "outlier":{

            "marker":{

                "type"="circle",

                "background-color": "##ff0"

            }

        }

    }

</cfscript>

<cfchart type="hboxplot"  format="html" title="Tenth boxplot (horizontal)" width="600"  height="400" options="#options#">

    <cfchartseries data="#ex1#">

    <cfchartseries data="#ex2#">

    <cfchartseries data="#ex3#">

</cfchart>
Output

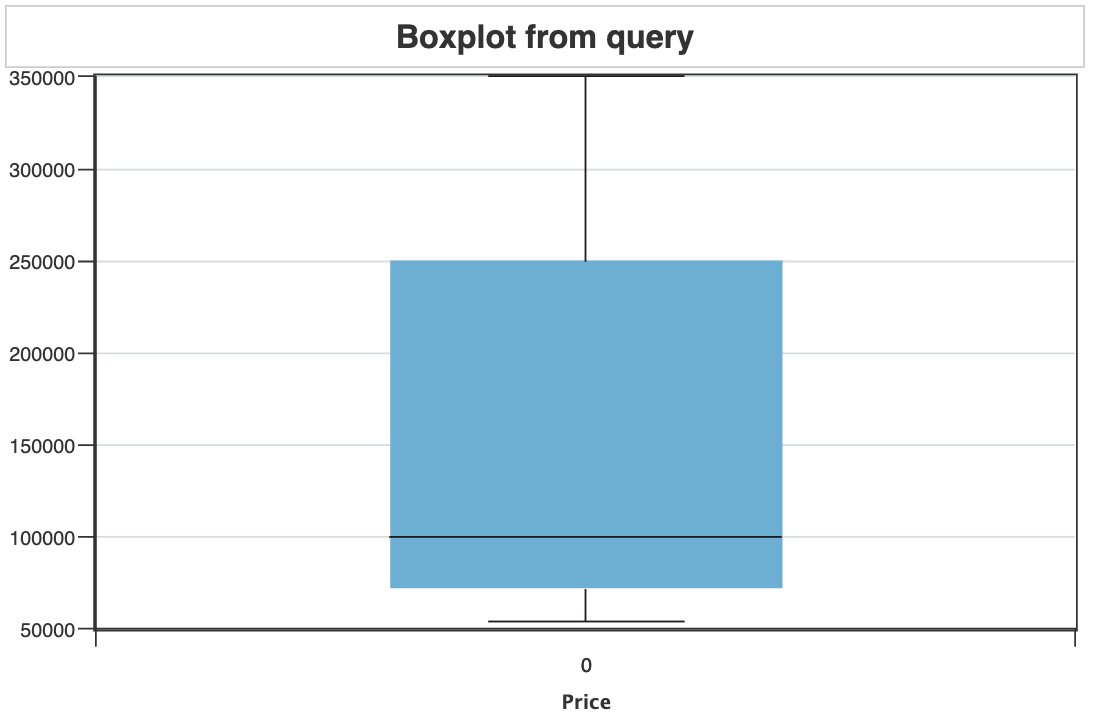
Example 11- boxplot from a query
<cfquery name="artQuery" datasource="cfartgallery">

    SELECT * FROM ART

    WHERE PRICE>50000

</cfquery>


<!--- <cfdump var="#artQuery#" > --->

<cfchart format="html" type="boxplot" width="600"  height="400" title="Boxplot from query" xaxistitle="Price">

    <cfchartseries  query="artQuery" valuecolumn="PRICE">

</cfchart>
Output
Example 12 - use cfchartset to lay out multiple boxplots
<cfscript>

    // define the data

   ex1={

        "key"="Experiment one results",

        "data"= [24, 30, 35, 38, 45, 45, 46, 48, 49, 51, 52, 53, 56, 57, 59, 60, 62, 70]

    }

    ex2={

        "key"="Experiment two results",

        "data"= [45, 25, 29, 50, 40, 56, 32, 32, 46, 65, 66, 24, 31, 29, 23, 30, 65, 56]

    }

    ex3={

        "key"="Experiment three results",

        "dataBox"=[35, 50, 45, 40, 55], // [min, q1, median, q3, max]

        "dataOutlier"=[25,60] // outlier array

    }

    ex4={

        "key"="Experiment four results",

        "dataBox"=[65, 66, 24, 31, 29], // [min, q1, median, q3, max]

        "dataOutlier"=[15,80,100] // outlier array

    }

    // boxplot styling options

    options={

        "box"={

            "bar-width":0.9,

            "background-color": "green"

        },

        "line-min-level": {

            "line-color": "red",

            "line-width":2

        },

        "line-median-level": {

            "line-color": "blue",

            "line-width":2

        },

        "line-max-level": {

            "line-color": "black",

            "line-width":2

        },

        'line-min-connector': {

            'line-width':2,

            'line-color': "##f00"

        },

        'line-max-connector': {

            'line-color': "black",

            'line-width':4

        },

        "outlier":{

            "marker":{

                "type"="circle",

                "background-color": "##ff0"

            }

        }

    }

</cfscript>

<cfchartset layout="2x2" width="800" height="600" format="html">

    <cfchart options="#options#" title="Boxplot 1">

        <cfchartseries type="boxplot" data = "#ex1#">

    </cfchart>

    <cfchart options="#options#" title="Boxplot 2">

        <cfchartseries type="boxplot" data = "#ex2#">

    </cfchart>

    <cfchart options="#options#" title="Boxplot 3">

        <cfchartseries type="boxplot" data = "#ex3#">

    </cfchart>

    <cfchart options="#options#" title="Boxplot 4">

        <cfchartseries type="boxplot" data = "#ex4#">

    </cfchart>

</cfchartset>
Output

Boxplot properties
Boxplot attributes | Options | ||
outlier | marker | type | |
backgroundColor | |||
bottomState | backgroundColor | ||
offsetX | |||
offsetY | |||
topState | backgroundColor: 'red', offsetX: 10, offsetY: 10 | ||
hoverMarker | backgroundColor | ||
tooltip | text | ||
backgroundColor: '#f90', borderColor: '#f60', borderRadius: -5, borderWidth: 2, callout: true, calloutHeight: 20, calloutPosition: 'bottom', calloutWidth: 0, padding: 10, shadow: true | |||
callOut | type: 'circle', | ||
backgroundColor: '#fff', | |||
borderWidth: 2, | |||
borderColor: '#f60', | |||
size: 5, | |||
offsetY: 0 | |||
mediaRules | maxWidth: 400, backgroundColor: 'red' | ||
rules | rule,backgroundColor | ||
topState | backgroundColor: 'red', offsetX: 10, offsetY: 10 | ||
hoverMarker | backgroundColor | ||
rules | rule | ||
backgroundColor |
We're glad. Tell us how this page helped.
We're sorry. Can you tell us what didn't work for you?
Share additional feedback to help us improve.
0/255
|